Articles
บทความเมืองแม่เหียะ กับการลดปริมาณคาร์บอน
(ตอนที่ 1) : แม่เหียะเมือง 2 ฝั่ง บ้านเรือน พื้นที่สีเขียว และผู้คน
จากความพยายามของประชาชน และเทศบาลเมืองแม่เหียะ ร่วมกับการสนับสนุนด้านวิชาการผ่านงบประมาณจากหน่วยบริหารและจัดการทุนด้านการพัฒนาระดับพื้นที่ (บพท.) นำไปสู่การขับเคลื่อนแม่เหียะ เมืองสีเขียว และเมือง low carbon ผ่านโครงการการพัฒนากลไกและต้นแบบธุรกิจที่เอื้อต่อการลงทุนเชิงพื้นที่ เพื่อมุ่งสู่การเป็นเมืองคาร์บอนต่ำที่น่าอยู่ เทศบาลเมืองแม่เหียะ โดยมุ่งหวังว่า การใช้ข้อมูลงานวิชาการ การวิเคราะห์ และการพัฒนาแผนงานอย่างมีส่วนร่วมจะนำมาซึ่งแนวทางปฏิบัติการ ที่ช่วยเสริมสร้างศักยภาพในการแก้ไขปัญหา และพัฒนาสิ่งแวดล้อมเมืองแม่เหียะ
โดยในขั้นต้น ได้มีการศึกษา ประมวล และสังเคราะห์ข้อมูลพื้นฐานเชิงพื้นที่ด้วยเทคนิคทางระบบสารสนเทศภูมิศาสตร์ (GIS) โดยนำข้อมูลการใช้ประโยชน์ที่ดิน ปี 2561 และปี 2565 ความหนาแน่นของแหล่งกำเนิดการจราจรซึ่งเป็นหนึ่งในปัจจัยหลักของการปลดปล่อยคาร์บอนในพื้นที่ ความสมบูรณ์ของพืชที่ปกคลุมพื้นที่ ความหนาแน่นของแหล่งกำเนิดการจราจรในพื้นที่ และอุณหภูมิผิวพื้น ร่วมกับข้อมูลด้านสังคม เช่น ความหนาแน่นของประชากรผู้สูงอายุในเขตเทศบาลเมืองแม่เหียะ นำมาสังเคราะห์ร่วมกัน เพื่อสร้างชุดข้อมูลที่จะช่วยบ่งชี้ การออกแบบแผนงานในอนาคต
ลักษณะพื้นที่
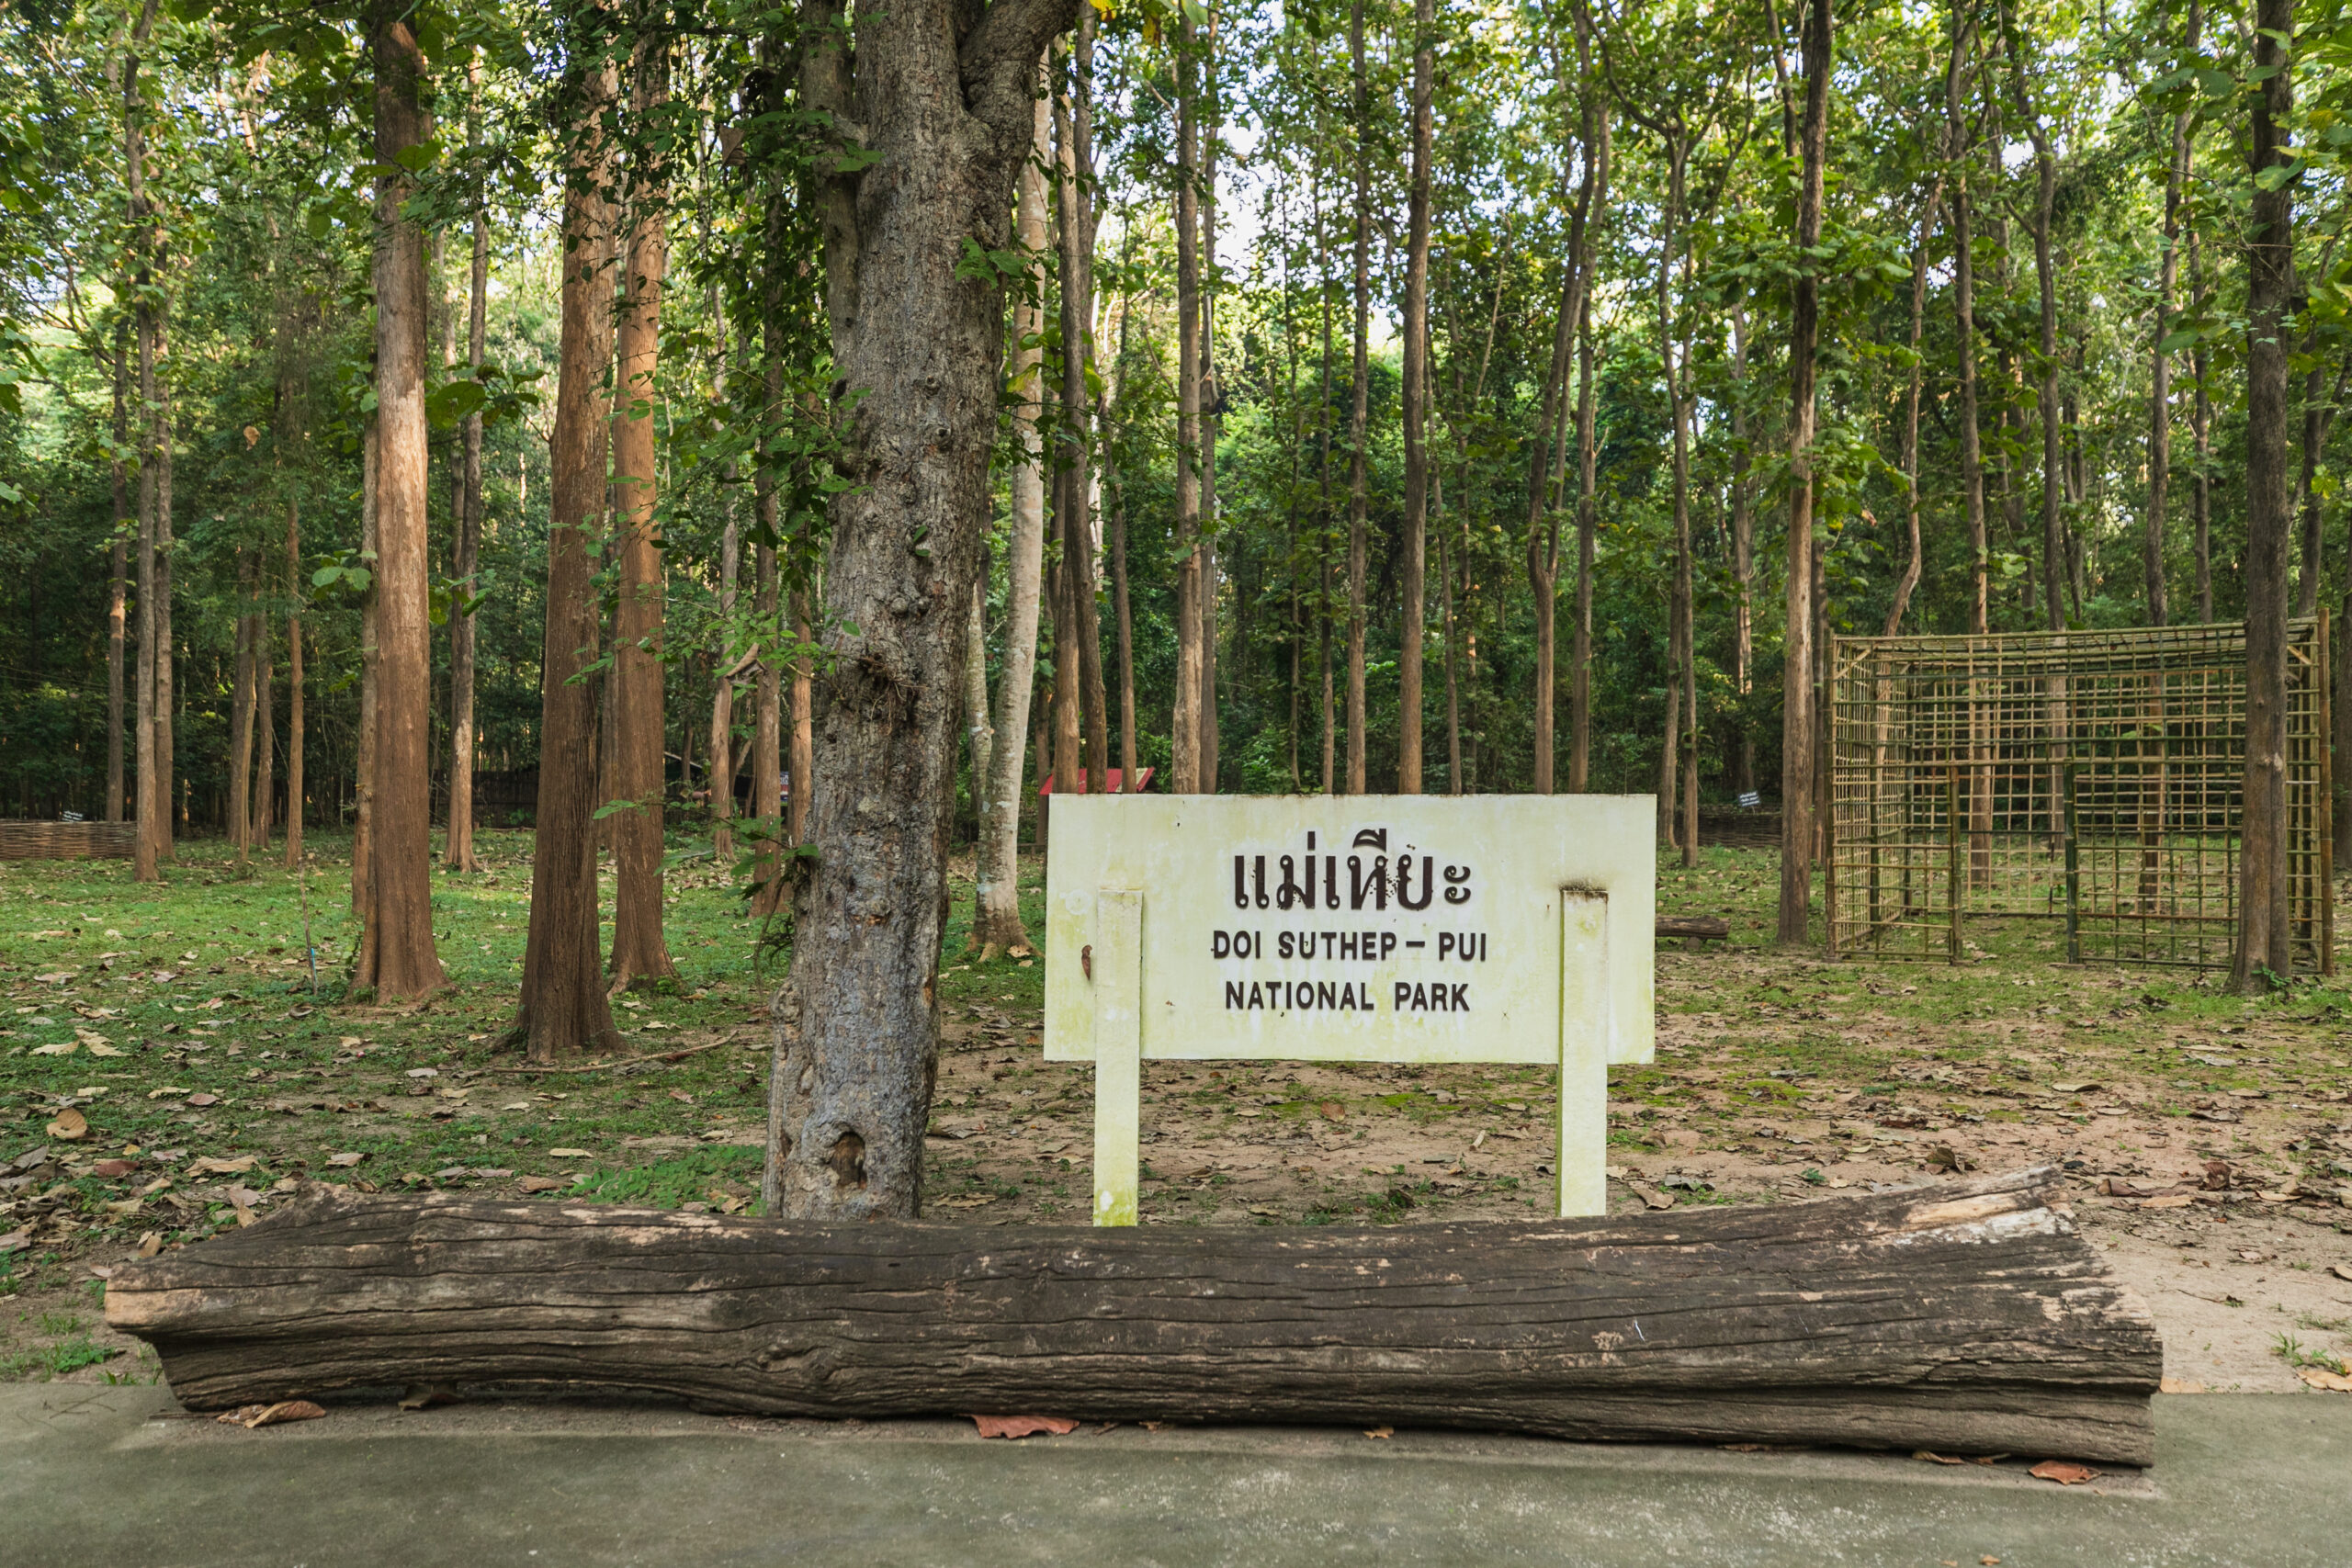
จากพื้นที่ของเทศบาลเมืองแม่เหียะที่มีอยู่ราว 8,454.27 ไร่ (ข้อมูลปี 2565) โดยภาพรวมสามารถแบ่งพื้นที่ได้เป็น 2 ฝั่ง คือฝั่งพื้นที่สีเขียว นันทนาการ และการศึกษา ในเขตพื้นที่ด้านตะวันตกถัดจากแนวเขตคลองชลประทาน เป็นเขตอุทยานแห่งชาติดอยสุเทพ-ปุย พื้นที่อุทยานหลวงราชพฤกษ์ และพื้นที่เชียงใหม่ไนท์ซาฟารี พื้นที่มหาวิทยาลัยเชียงใหม่ (ส่วนแม่เหียะ) ซึ่งทั้งหมดอยู่ในความดูแลของส่วนราชการ และพื้นที่เขตชุมชนและเมือง นับจากด้านทิศตะวันออกของคลองชลประทาน ไปจรดเขตเทศบาลเมืองแม่เหียะ บ้านหมู่ 7 ตำบลใหม่พัฒนา คิดเป็นสัดส่วนพื้นที่สีเขียวร้อยละ 49 และพื้นที่อยู่อาศัย บ้านเรือน ร้านค้า สิ่งก่อสร้าง ราวร้อยละ 51
สำหรับแนวโน้มในอนาคต การเปลี่ยนแปลงการใช้ที่ดินเปรียบเทียบข้อมูลย้อนหลัง ปี 2561 เทียบกับปี 2565 พบว่า มีการเปลี่ยนแปลงในส่วนของพื้นที่เกษตร พื้นที่ว่างรกร้าง มีสัดส่วนของพื้นที่ลดลง เนื่องจากถูกปรับเปลี่ยนเป็นพื้นที่เมือง หมู่บ้าน และย่านการค้า
คนแม่เหียะ
ตามข้อมูลสถิติของเทศบาลเมืองแม่เหียะระบุว่า จากปีพ.ศ.2554-2564 จำนวนประชากรในเขตเทศบาลค่อนข้างคงที่ เฉลี่ยจำนวนประชากรรวมมีอยู่ราว 19,000 คน เฉลี่ยแล้วเป็นชาย 8,600 คน และหญิง 10,300 คน เมื่อนำข้อมูลมาจัดเรียงในรูปแบบพีรามิดประชากรโดยใช้ข้อมูลช่วงเวลา 10 ปี (พ.ศ.2555-2564) พบว่าเทศบาลเมืองแม่เหียะกำลังเข้าสู่สังคมผู้สูงอายุ (พิจารณาตามเกณฑ์ขององค์การอนามัยโลก WHO ที่ระบุนิยามสังคมผู้สูงอายุ หมายถึงสังคมที่มีผู้สูงอายุอายุ 60 ปีขึ้นไปเป็นสัดส่วนตั้งแต่ 20% ของประชากรทั้งหมด) เนื่องจากมีจำนวนประชากรวัยเยาว์และวัยแรงงานน้อยกว่าประชากรสูงวัย และมีแนวโน้มชัดเจนว่ามีประชากวัยแรงงานที่กำลังก้าวเข้าสู่วัยชรามีจำนวนสูง ส่วนทางกับประชากรวัยเยาว์ที่มีจำนวนลดลงอย่างมีนัยยะสำคัญ
หากพิจารณาการกระจายตัวของประชากรสูงวัย จะพบว่าทั้งหมดกระจุกตัวอยู่ในพื้นที่ตัวเมือง หมู่บ้าน และย่านการค้า โดยเฉพาะอย่างยิ่งทางด้านตะวันออกของพื้นที่เทศบาลเมืองแม่เหียะ
พื้นที่สีเขียวเพื่อคนแม่เหียะ
เมื่อพิจารณาข้อมูลเชิงพื้นที่ของพื้นที่สีเขียว และรูปแบบการอยู่อาศัยในเรื่องการกระจายตัวของผู้คน พบว่าปรากฏการณ์เมือง 2 ฝั่ง มีทั้งข้อดีและข้อด้อยในการสนับสนุนคุณภาพชีวิตของผู้คนเมืองแม่เหียะ
ข้อดี – การมีพื้นที่สีเขียว และพื้นที่นันทนาการขนาดใหญ่อยู่ในพื้นที่ ในระยะทางไม่ไกล ใช้เวลาเดินทางไม่ถึง 15 นาที ซึ่งถือว่าเป็นการเข้าถึงที่ง่าย อีกทั้งในพื้นที่ดังกล่าวยังมีสิ่งอำนวยความสะดวก และพื้นที่เอื้อสำหรับกิจกรรมเพื่อพัฒนาสุขภาพให้กับหลายช่วงวัย ถือว่าเป็นจุดแข็งของเมืองที่ควรได้รับการส่งเสริมต่อยอด
ข้อด้อย – การเข้าถึงพื้นที่สีเขียว ในพื้นที่อยู่อาศัยและย่านการค้าฝั่งตะวันออก มีสัดส่วนพื้นที่สีเขียวอยู่น้อย และไม่มีพื้นที่ว่างเพื่อการพื้นที่สีเขียว หรือพื้นที่สาธารณะในอนาคต การเข้าถึงพื้นที่สีเขียวที่ดี มีคุณภาพจำต้องพึงพาพื้นที่ฝั่งตะวันตก และพึงพาการเดินทางโดยรถยนต์ ด้วยสภาพทางสัญจรหลักของเมืองแม่เหียะเป็นถนนขนาดใหญ่ และซุปเปอร์ไฮเวย์ การเดินทางจึงจำเป็นต้องใช้รถ ทั้งเพื่อความเหมาะสมในการสัญจร และความปลอดภัย การไม่มีระบบขนส่งมวลชน ก็ยิ่งเป็นปัจจัยเร่งให้เกิดการใช้พลังงานและการปลดปล่อยคาร์บอน ส่งผลเสียต่อคุณภาพอากาศของพื้นที่โดยรวม
Mae Hia City and reduction of carbon content Part 1: Mae Hia, two sides, houses, green spaces and people
Through the efforts of citizens and Mae Hia Municipality, together with academic support budget provided by the Area Development Capital Administration and Management Unit (TASC), Mae Hia is being developed as a green and low-carbon city through the development of mechanisms and business models that facilitate per area investment. In striving towards a livable low-carbon city, Mae Hia Municipality hopes that participatory use of academic data, analysis and program development will lead to action that helps strengthen the potential to solve issues and develop the environment around Mae Hia.
Initially, baseline data was studied, processed and synthesized using Geographic Information System (GIS) techniques, utilizing land-use data from 2018 to 2022. Traffic sources and density, one of the main determinants of local carbon emissions, abundance and coverage of plant life in the area, surface temperature, together with social data, such as elderly population density in Mae Hia Municipality, are synthesized to create a data set that will help determine the design of future plans.
Area characteristics
The overall area of Mae Hia Municipality, covering approximately 8,454.27 rai (2022 data), can be divided into two sides. First, the green area, for recreation and education, sits to the west of the irrigation canal. This area contains Doi Suthep-Pui National Park, Royal Park Rajapruek, Chiang Mai Night Safari, and Chiang Mai University (Mae Hia), all of which are under government supervision. Second, the urban area, stretching from the east of the irrigation canal to Mae Hia Municipality, Village No. 7, Tambon Mai Patthana, accounts for 49% of green space and around 51% of residential area, homes, shops and buildings.
Regarding future trends, based on changing land use when comparing historical data from 2018 to 2022, agricultural areas have experienced the most change, together with decreased proportion of landfill area due to transformation into urban, village and commercial zones.
People of Mae Hia
Statistical data from Mae Hia Municipality indicates that, between the years 2011 – 2021, the municipal population remained relatively stable, with an average total population of around 19,000 people, consisting of an average of 8,600 males and 10,300 females. When considered according to criteria set by the World Health Organization (WHO), which defines an aging society as one in which the elderly (aged 60 years and above) form 20% or more of the total population, Mae Hia is becoming an aging society due to lower young and working-age populations compared with elderly population. In addition, a clear trend is that of greater proportions of working-age people entering old age, caused by a significant decrease in the younger population.
Regarding distribution of the elderly population, it was found that all are concentrated in urban areas, villages and commercial areas, especially on the eastern side of the Mae Hia Municipality area.
Green space for the Mae Hia people
Considering spatial data of green areas, living patterns, and population distribution, it is evident that urban phenomenon on both sides of Mae Hia have advantages and disadvantages with respect to supporting the quality of life of Mae Hia residents.
Advantages – local green areas and large recreation areas in close proximity, less than 15 minutes travel time, considered “easy access”. Also in the area are facilities and spaces conducive to activities for improving health for many generations – considered a strong asset of the city that should be promoted further.
Disadvantages – regarding access to green areas in the eastern residential/commercial area, there is a small proportion of green space and no room for further expansion of green or public space in the future. Therefore, easy access to quality green space is reliant on the western area, and thus dependent on travel by car, due to the conditions imposed by the main thoroughfares of Mae Hia City, namely large roads and super-highways. Travel must therefore be made by car due to suitability, safety and lack of public transportation, thereby increasing energy consumption and carbon emissions, and negatively affecting air quality of the area as a whole.

